Basic Approaches
- Check logs and see if any error messages/exceptions there.
- Check system status - CPU, memory, disk, network, etc. See if any abnormal patterns exist.
Useful Commands
Display Processes
$ ps aux # BSD syntax
$ ps -ef # Standard syntax
$ ps aux --sort=-pcpu | head -5 # Display the top 5 processes consuming most of the cpu. "-" symbol means descending
order.
$ ps aux --sort=-pmem | head -5 # Display the top 5 processes consuming most of the memory.
Top
$ top # Show stats of all processes
$ top -p <pid> # Show stats of specific process
Result explanation:
-
Line 1: <Current time> <How long the computer has been running> <Number of users> <Load Average>
Example: top - 07:33:07 up 40 days, 23:03, 3 users, load average: 0.00, 0.00, 0.00
-
Line 2: <Total number of tasks> <Number of running tasks> <Number of sleeping tasks> <Number of stopped tasks> <Number of zombie tasks>
Example: Tasks: 229 total, 1 running, 228 sleeping, 0 stopped, 0 zombie
-
Line 3: <CPU usage by the user> <CPU usage by system> <CPU usage by low priority processes> <CPU usage by idle processes> <CPU usage as a percentage by io wait> <CPU usage by hardware interrupts> <CPU usage by software interrupts> <CPU usage by steal time>
Example: %Cpu(s): 0.3 us, 0.0 sy, 0.0 ni, 99.7 id, 0.0 wa, 0.0 hi, 0.0 si, 0.0 st
-
Line 4: <Total system memory> <Free memory> <Memory used> <Buffer cache>
Example: KiB Mem : 16430776 total, 4949560 free, 2204728 used, 9276488 buff/cache
-
Line 5: <Total swap available> <Total swap free> <Total swap used> <Available memory>
Example: KiB Swap: 999420 total, 999420 free, 0 used. 13673696 avail Mem
-
Main table: <Process ID> <User> <Priority> <Nice level> <Virtual memory used by process> <Resident memory used by a process> <Shareable memory> <CPU used by process> <Memory used by process> <Time process has been running> <Command>
Example: 26147 hechaol 20 0 4660220 760376 45048 S 0.3 4.6 1:38.17 java
On top display page, press:
- P Sort by CPU usage
- M Sort by memory usage
Network
$ netstat -nlpt # List listening (-l) tcp (-t) sockets and show numerical addresses (-n) as well as print process ID
(-p)
$ netstat -anpt # List both listening and non-listening sockets (-a)
$ lsof -i # List all connections
$ lsof -i:8080 # List all processes that use port 8080
$ lsof -i -sTCP:LISTEN # List all listening files
$ lsof -i -sTCP:ESTABLISH # List all established fiels
Disk
$ df -h # Show the space on all currently mounted file systems in human-readable format
$ du -h -s . # Summarize disk usage of current directory. Same as du -h -d 0 .
$ du -h -d 1 . # Summarize disk usage of current directory, depth is 1
$ iotop # Need to be installed
$ iostat # Need to be installed
Jps
$ jps -l # List all java processes
$ jps -lv # List all java processes in verbose mode
Java Thread Dump
$ jstack -l <pid> > threaddumps.log # JDK must be installed in order to run this command
Java Thread States:
- NEW: A thread that has not yet started is in this state.
- RUNNABLE: A thread executing in the Java virtual machine is in this state.
- BLOCKED: A thread that is blocked waiting for a monitor lock is in this state.
- WAITING: A thread that is waiting indefinitely for another thread to perform a particular action is in this state.
- TIMED_WAITING: A thread that is waiting for another thread to perform an action for up to a specified waiting time is in this state.
- TERMINATED: A thread that has exited is in this state.

Java Heap Dump
$ jmap -heap <pid> # Dump the heap
$ jmap -histo <pid> # Dump instances and size
$ jmap -dump:format=b,file=heapdump.hprof <pid> # Dump the heap in hprof format so that we can use Yourkit to analyze
Java Native Memory Tracking
Supported since Java 8. It can be used to track internal memory usage for a HotSpot JVM. http://docs.oracle.com/javase/8/docs/technotes/guides/vm/nmt-8.html http://docs.oracle.com/javase/8/docs/technotes/guides/troubleshoot/tooldescr007.html
Useful Tools
Yourkit Java Profiler
https://www.yourkit.com/java/profiler/features
Remote Profiling Setup
Official Guide: https://www.yourkit.com/docs/java/help/remote_profiling.jsp
To sumarize, there are two ways to remote profile an application. One is using Yourkit’s console version of Java EE
server integration wizard, which is foolproof. The other way is to enable profiling manually by starting JVM with
additional options. See https://www.yourkit.com/docs/java/help/agent.jsp. The option is in format -agentpath:<full agent library
path>[=<option>, ...]. For full set of options, see startup_options
Port Forwarding
If the application can only be accessed from a jump host, which can be accessed by our own laptop, then we need to have
port forwarding on both the machine that runs the application and the jump host. For example, if the topology is:
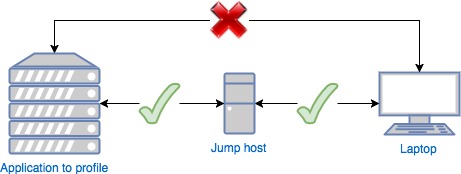
Then you need to do the following steps: First, run the following command on application machine:
$ ssh -R <agent_port>:localhost:<agent_port> <jumphost_user>@<jumphost_ip>
This command will forward any connection to <agent_port> on application machine to the same port on jump host. Second, run the following command on jump host:
$ ssh -R <agent_port>:localhost:<agent_port> <laptop_user>@<laptop_ip>
Agent port is the port you set in the profiler startup option. For example,
-agentpath:/home/libyjpagent.so=listen=0.0.0.0:12345. Then the agent_port is 12345. Open YourKit GUI on the laptop and
click “Connect to remote application…”. Input “localhost:12345” and click “connect”.
YourKit CLI
This is useful when there is no UI available. Run the tool with the following command:
$ java -jar <Profiler Installation Directory>/lib/yjp-controller-api-redist.jar <options>
$ java -jar <Profiler Installation Directory>/lib/yjp-controller-api-redist.jar # Get list of available options
$ java -jar yjp-controller-api-redist.jar localhost 12345 start-cpu-tracing # Enable CPU profiling
$ java -jar yjp-controller-api-redist.jar localhost 12345 start-alloc-recording-all # Enable memory profiling
$ java -jar yjp-controller-api-redist.jar localhost 12345 capture-performance-snapshot # Capture performance snapshot
JProfiler (TODO)
https://www.ej-technologies.com/products/jprofiler/overview.html
Similar to Yourkit. But I have no experience.
JVisualVm
This is a Java Virtual Machine Monitoring, Troubleshooting, and Profiling Tool provided by JDK. I have no experience and I am not sure if it is as good as YourKit or JProfiler. But this is a free tool. See jvisualvm